
Markdown copy of 2026-10-29 Pathways to College in California.html, made 2026-10-29. The original is the authority. Skip to main content
C2C home
- Search
- Translate
Menu Close
-
Data & Impact
-
Back
-
Dashboards
- Student Pathways Data Story
- All Dashboards
-
Data Tools
-
About the Data
- Data Points
- Data Providers
- Data Elements by Provider
- Data Integrity
- Data System Privacy
-
-
College & Career Planning
-
Back
-
Planning Tools
-
Making a Choice
-
Applying to College
-
-
Get Involved
-
About
-
Back
-
About Us
-
Our Impact
-
Get in Touch
-
-
News
- Back
- News & Blog
-
Search
-
Translate
Translate
The California Cradle-to-Career Data System (C2C) website uses Google™️ Translate to provide automatic translation of its web pages. This translation application tool is provided for purposes of information and convenience only. Google™️ Translate is a free third-party service, which is not controlled by the C2C. C2C is unable to guarantee the accuracy of any translation provided by Google™️ Translate and is therefore not liable for any inaccurate information or changes in the formatting of the pages resulting from the use of the translation application tool.
The web pages currently in English on the C2C website are the official and accurate source for the data and services the C2C provides. If any questions arise related to the information contained in the translated website, please refer to the English version.
The following content provided on the C2C website cannot be translated using Google™️ Translate:
- Data visualization and tables
- Downloadable assets, including PDFs
Close
Home / Dashboards / Pathways to College in California
Pathways to College in California
Share
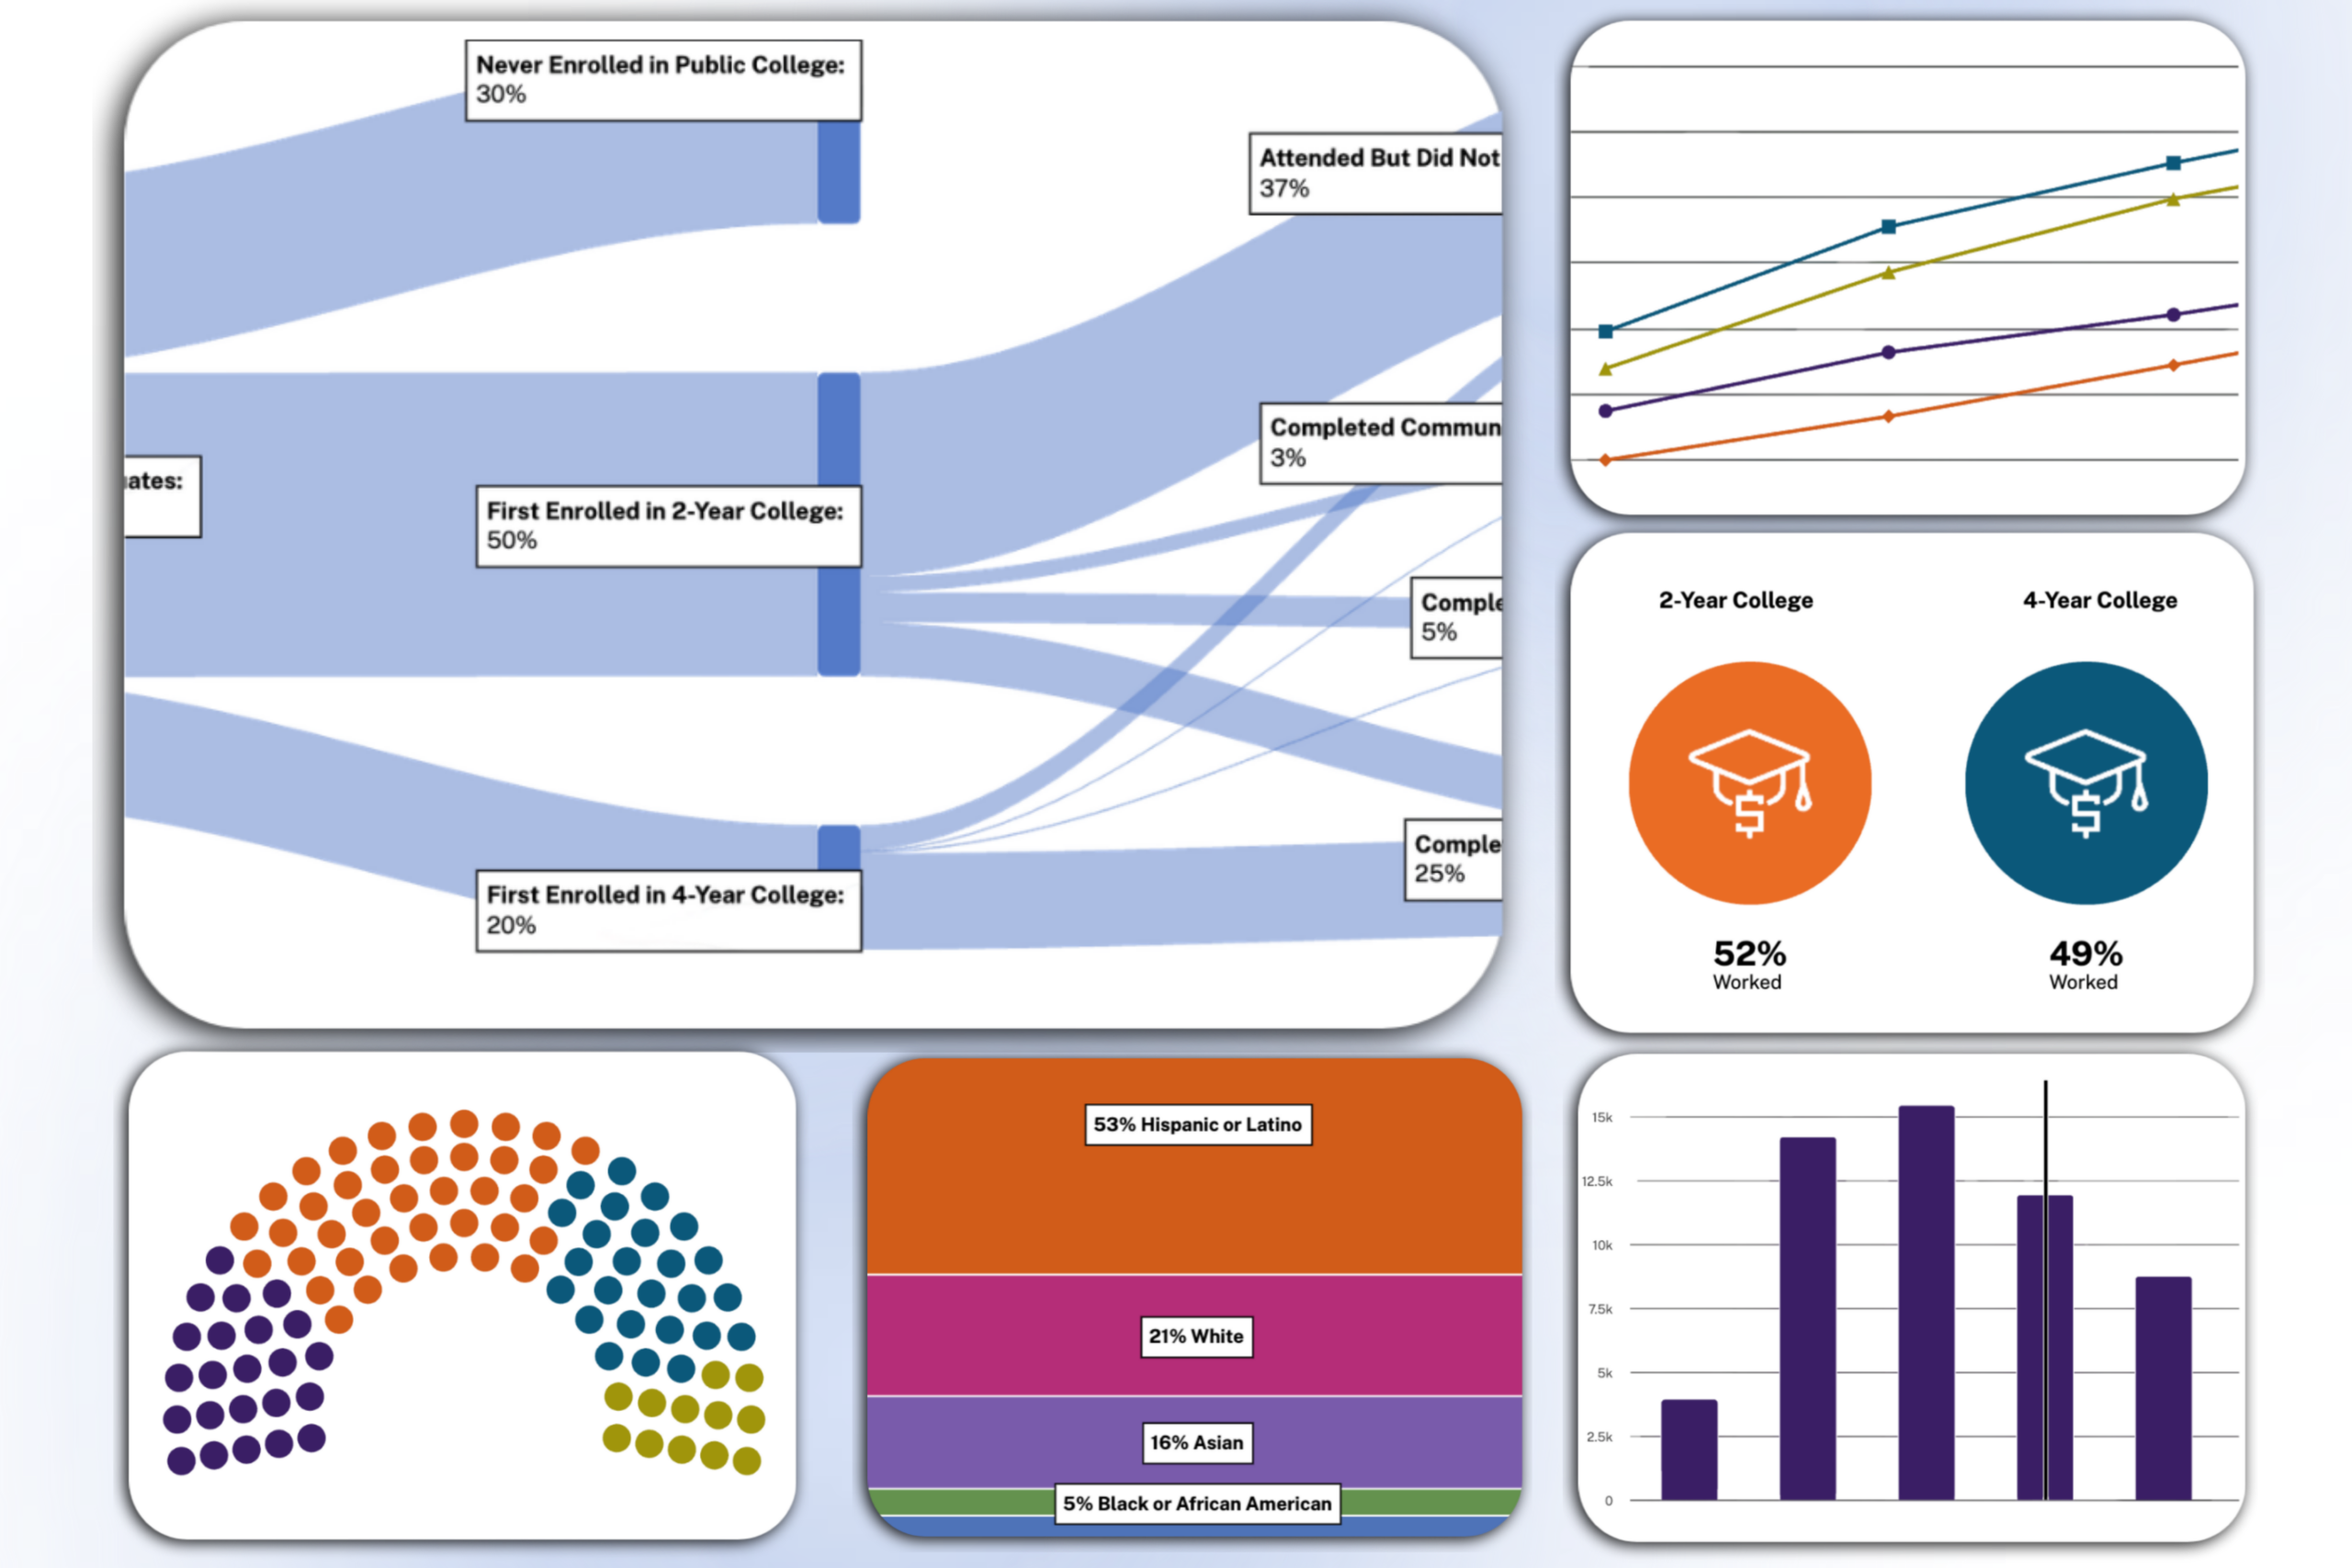
California is a hub for education, and the state leads the nation with the highest number of college-going students. Yet, not all paths to a postsecondary education are linear. Every student has a unique educational journey. The Student Pathways Data Story provides information on key milestones for students as they navigate from high school to college and into their careers over time.
Find your story
Explore a series of data visualizations that show student transitions from California’s public high schools to California public colleges and universities and into the workforce. See outcomes for different student populations. Analyze:
- How much students earn after earning a degree
- Which types of degrees or awards students earn
- How many students work while attending college
What story does the data tell about my community?
Filter by California school district or legislative district to learn about students in your community. Select a student population by race/ethnicity, gender, foster youth status, or other data elements to better understand students’ experiences in California.
Click here for the full Student Pathways Dataset
Recursos en español
Bienvenidos a la Historia de Datos de Student Pathways. No todos los elementos de esta página serán traducidas cuando use la herramienta de traducir que está arriba en la esquina a la derecha de este sitio web. Pero, podra encontrar recursos sobre cómo usar el sistema de datos aquí: Recursos en español.
View Filters
Close Filters
District Type
By School District
By Legislative District
Select One
District Type
Filter the Data Story with data for students based on the legislative district in which they attended high school. Help me find my school’s legislative district.
School District
Type to Select One
Legislative District
Type to Select One
Student Population
Select One
Student Population
Filter the Data Story with data for students based on their Race/Ethnicity, Gender, Foster status, or Homelessness status. Learn more about how C2C defines student populations and plans to expand filter options on our Data Definitions and FAQ page.
Apply Filters
How have California students navigated to and through college?
Explore the different educational paths Californians take after graduating from high school.
The visualization below shows the paths of students who graduated from California public high schools in the 2014-2015 academic year. The diagram highlights the different paths these students took, whether they went into the workforce after high school, enrolled in a 2-year public college, or attended a 4-year public college. The outcomes for all paths differ to create a unique story for each California student.
Who’s included in the diagram?
- Students who graduated from a California public high school in 2014-2015 with a standard diploma. Does not include GED or other types of high school completion.
- Students who graduated from a California public high school in 2014-2015 and then enrolled in a California public 2-year or 4-year college within nine years of graduating from high school.
- Students who graduated from a California public high school in 2014-2015 and then earned an Associate degree, Bachelor’s degree, or Community College Certificate within nine years of graduating from high school. Future updates to the data story will include data on advanced degrees that students may earn in this time period.
- Note: “Never Enrolled in a California Public College” currently includes students who attended private colleges within California and out-of-state colleges, as well as those who choose not to go to college. Future updates to the data story will include data on attendance in private or out-of-state colleges.
How do I read this chart?
Student Pathways from High School Graduation to a College Degree
Close
This diagram shows different educational paths taken by 2014–2015 California public high school graduates in the nine years after they graduated from high school. You can hover over any part of the diagram to see counts for each outcome.
Read the diagram from left to right. On the far left, the diagram shows the full group of students in the high school graduating class of 2014-2015. The next section to the right shows one of three paths to college enrollment. The top branch highlights the path of students who never enroll in a California public college within nine years. This group may enroll in private or out-of-state colleges, or they may decide not to enroll in college at all. In future versions of this data story, C2C plans to include data that will allow you to investigate these distinctions. The middle and bottom paths indicate whether students’ first college enrollment was in a 2-year California public college (a community college) or a 4-year California public college (a UC or CSU campus). Finally, the last section on the right shows four different certificate and degree completion outcomes: how many completed a community college certificate, how many completed an Associate degree, how many completed a Bachelor’s degree, and how many attended but did not yet complete a degree at a California public college.
While the “Student Pathways” diagram above provides an overview of students’ journeys over time, the following visuals focus on key milestones at specific points in time.
Who enrolls in college?
Explore a snapshot of first-time college enrollment broken down by student demographic for students who first enrolled in the selected academic year.
Who’s included in the diagram?
- Students who graduated from public California high schools in any academic year between 2014-2015 and 2023-2024
- and who are enrolling for the first time at a public 2-year or 4-year college in the selected academic year.
Changing the form filters will update the chart data automatically.
The chart “First Time College Enrollment by Student Population” will update automatically when changes are made to the filters.
First Enrollment Year
Loading…
Institution Type
Loading…
How do I read this chart?
First Time College Enrollment by Student Population
Close
This visualization shows the demographics of students who enrolled in any California public college for the first time in the selected academic year. Each colored bar represents a specific population group. You can hover over any part of the diagram to discover the exact numbers.
Select a specific school district or legislative district to display a side-by-side comparison with statewide statistics. You may notice significant differences between the California statewide statistics and a specific district’s statistics. This may be because the underlying demographic characteristics of the district are different than those of the entire state. For example, a district where a smaller proportion of college-going students are Asian may have a smaller proportion of Asian students than California overall.
To interpret a specific district’s statistics, it is helpful to examine the demographic breakdown of students from that district. You can find data on student enrollment by demographic at ed-data.org. Select the district and view the Census Day Enrollment chart for the relevant student population.
What types of degrees do students earn?
Students receive different degrees and awards from California public colleges. Whether they received a certificate from their local community college or transferred from a public 2-year college to a public 4-year college, there are many paths to earning credentials after high school.
Who’s included in the diagram?
- Students who graduated from public California high schools in any year between 2014-2015 and 2023-2024
- and earn a degree or certificate from a California public college in a selected academic year between 2018-2019 and 2023-2024.
Changing the form filters will update the chart data automatically.
The chart “Degrees and Certificates Earned at CA Public Colleges” will update automatically when changes are made to the filters.
Graduation Year
Loading…
How do I read this chart?
Types of Degrees and Certificates Earned at CA Public Colleges
Close
The chart features 100 dots, each symbolizing 1% of all degrees earned in the selected academic year. The number of dots of each color indicates the percentage of awards granted that year per award type. Specific colors represent the different award types:
- Community college certificates
- Associate degrees (including Associate degrees for Transfer, or ADTs)
- Bachelor’s degrees (split between non-transfer students and for students who transfer from a 2-year to a 4-year institution)
Once students enroll in college, how long does it take them to graduate?
Explore how long it takes students to complete their degrees, based on when they first enrolled in the college from which they earned their degree. (Note: For students who attend multiple institutions or transfer, this means that the full length of their degree journey is not included in the current version of this chart. Future dashboards will explore the transfer journey in more detail).
Who’s included in the diagram?
- Students who graduated from public California high schools in any year between 2014-2015 and 2023-2024
- and earn a degree or certificate from a California public college in a selected academic year between 2018-2019 and 2023-2024.
Changing the form filters will update the chart data automatically.
The chart ‘Median Time to Award for Graduates of CA Public Colleges’ will update automatically when changes are made to the filters.
Graduation Year
Loading…
Degree Type
Loading…
How do I read this chart?
Median Time to Degree for Graduates of CA Public Colleges
Close
This data visualization shows how long it takes students to complete a degree or certificate at a California public college. We calculate the time to award from when a student first enrolls in the institution where they earn their award. For students who attend multiple institutions or transfer, this means that the full length of their degree journey is not included in the current version of this chart. Future dashboards will explore the transfer journey in more detail.
The height of each bar shows the numbers of students who completed their award in the specific number of years. The chart also includes an indicator of the median time it took students in the visualization to earn their award. The median is the number that divides the group in half, so that half of students took the median or more time to complete their award, and half of students took less time than the median to complete their award.
What about students who work while they are enrolled in college?
Learn about California students working while enrolled in college. Filter by academic year or toggle between metrics to examine median earnings or the percentage of students working.
Who’s included in the diagram?
- Students who graduated from public California high schools after 2014
- and report earnings on a W-2 for at least three of the four quarters of the year.
Changing the form filters will update the chart data automatically.
The chart ‘Percent of Students Who Work While Enrolled in College’ will update automatically when changes are made to the filters.
Academic Year
Loading…
Data Type
Percent Working
Earnings
How do I read this chart?
Percent of Students Who Work While Enrolled in College
Close
This infographic shows data for students who work while enrolled in college. You can choose between seeing the percentage of students who work and their median annual wages. Annual wages are calculated by adding up students’ quarterly earnings. The median is the number that divides the group in half, so that half of students earn the median wage or more money every year, and half of students earn less than the median wage.
The percent of students working are calculated as a proportion of all of the students enrolled in a specific type of institution (2-year California public college or 4-year California public college) in a specific academic year. “Enrolled students” is limited to students who graduated from a California public high school after 2014.
For the Student Pathways Dashboard, students who work while enrolled in college are defined as students who report earnings on a W-2 for at least 3 of the 4 quarters of the year.
How much do students earn after they graduate?
Learn about how much California public college graduates and certificate earners earn over time. View information on the median annual earnings of college graduates every year for up to five years after earning their award and see the change in earnings over time.
Who’s included in the diagram?
- Students who graduated from public California high schools in any year between 2014-2015 and 2023-2024
- and who completed a degree or certificate from a California public 2-year or 4-year college,
- and who have jobs in California,
- and who report earnings on a W-2 for all four quarters of the year.
Changing the form filters will update the chart data automatically.
The chart ‘Median Wages for CA Public College Graduates Employed in CA’ will update automatically when changes are made to the filters.
Graduation Year
Loading…
How do I read this chart?
Median Wages for CA Public College Graduates Employed in CA
Close
This line graph shows median annual earnings for college graduates from California public colleges in each of the years following the year they earned their degree or certificate. The visualization only includes data for those who work year-round. It does not include those who work seasonally or have gaps in their employment. Different types of degrees and certificates appear as different colored lines. If someone earned a degree less than 5 years ago – for example, in the 2021-2022 academic year – the visualization only shows data for the years after graduation.
The data only includes people with earnings on a W-2 reported for all four quarters of the year. For these students, we calculate annual wages by adding up their quarterly earnings and reporting the median wage. The median is the number that divides the group in half, so that half of students earn the median wage or more money every year, and half of students earn less than the median wage.
To reference this dataset in publications or reports, please use this citation: California Cradle-to-Career Data System (2026). Student Pathways Data Story (Version number 2.0). c2c.ca.gov/data-stories/pathways-to-college-in-california/
We want to hear from you!
While launches may feel like the end of a process, for us, it’s just the beginning. You helped us build it, now help us improve it. We know there are more stories to be told beyond this first release, and we want to hear from you.
Learn about data system privacy.
All of the student data we use in our stories is anonymous. Student personal information is never collected or displayed on C2C.
Opens in new window
Stay Informed!
Get the latest dashboards and updates to the Cradle-to-Career System
How we use data**:**
The Office of Cradle-to-Career Data does not collect new data from students or families. It links and enables the public to gain insights from data that has already been collected and validated by its data partners. Learn more about data privacy.
About
- Mission & Vision
- Leadership
- Roadmap & Progress
- Reports & Resources
- Press Center
- Careers
- Press Releases
Tools
- Dashboards
- Query Builder: Student Pathways Dataset
- College Planning & Application Tools
- eTranscript California
Get Involved
Copyright © 2026 State of California